🪨 Pebble Math Visualizer –
Mathematics becomes far easier when we see it instead of memorizing formulas.
This entire lesson is built around the ancient and intuitive idea of calculating using pebbles.
If you ever learned addition by joining stones, or subtraction by removing them, this visualizer brings that same clarity to:
If you ever learned addition by joining stones, or subtraction by removing them, this visualizer brings that same clarity to:
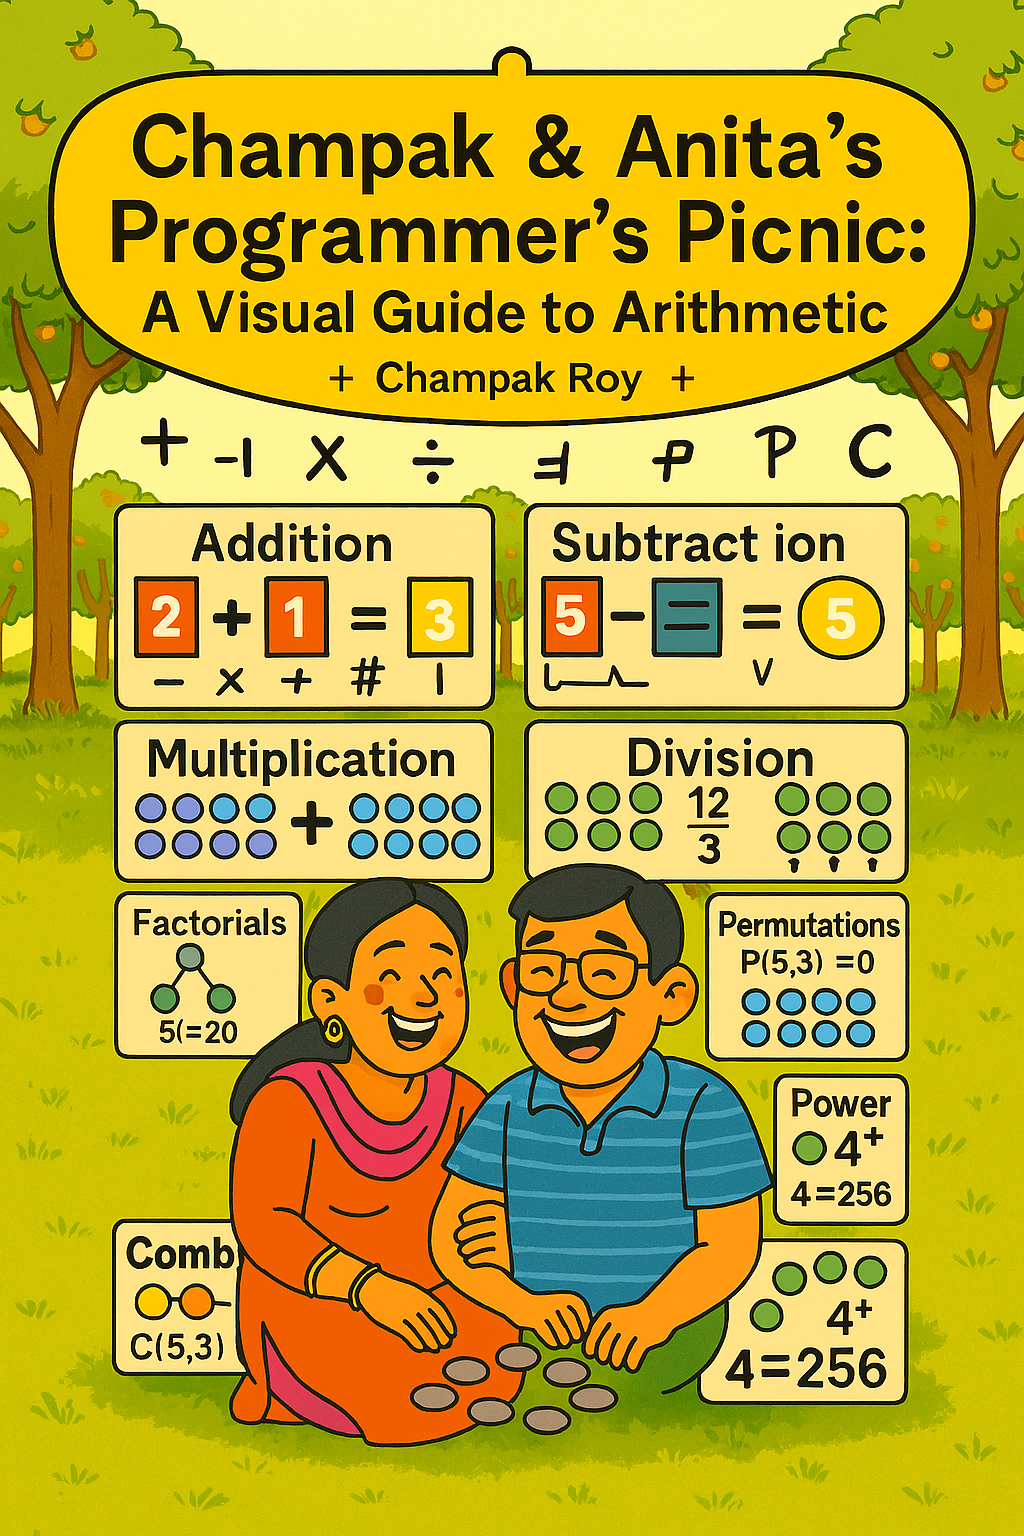
- ➕ Addition
- ➖ Subtraction
- ✖️ Multiplication
- ➗ Division & Remainder
- ! Factorials
- 🔀 Permutations
- 🎯 Combinations
- 🌿 Powers
Every concept is shown with colored pebbles and gentle animations—designed for students, self-learners, and visual thinkers.
🎬 Interactive Visualizer
Below is the full Pebble Math Visualizer.
If you are using a phone, rotate to landscape for the best experience.
🌟 Why Pebbles?
Humans understood numbers long before books were invented.
We counted fruits, measured distance using footsteps, and visualized arithmetic using physical markers.
Pebbles are perfect because:
Pebbles are perfect because:
- They create instant visual memory
- Every rule becomes a pattern you can see
- Math turns into playful experimentation
This visualizer revives that natural learning style using clean saffron aesthetics.
➕ Addition – Putting Pebbles Together
To compute a + b, the tool creates:
- A-row of a pebbles
- B-row of b pebbles
- A final row where both are joined
The final row animates, showing how combining two piles gives one larger pile.
➖ Subtraction – Removing Pebbles
Start with a pebbles.
Remove b pebbles visually.
The removed ones turn grey.
This builds the intuition that subtraction simply removes items from a real pile.
✖️ Multiplication – Repeated Addition
To compute a × b:
- The tool creates b rows
- Each row contains a pebbles
A simple but powerful idea:
Multiplication is lots of additions done neatly in rows.
➗ Division & Remainder – D3 Model
This is one of the most elegant visualizations in the tool.
To compute a ÷ b:
To compute a ÷ b:
- First lay out all a pebbles
- Divide them into groups of size b
- Each complete group gives one quotient pebble
- Leftover pebbles form the remainder
This makes the rule
a = b × q + r visually obvious.
! Factorial – Building Step by Step
The factorial part shows how:
- 1! = 1
- 2! = 2
- 3! = 6
- 4! = 24
Each new pebble is inserted into every possible slot of previous permutations — beautifully animated.
Higher factorials grow too fast, so the visualizer summarizes them neatly.
🔀 Permutations – Order Matters
For each stage k:
The new pebble k is inserted into every possible empty place of the previous permutations.
This mirrors the natural growth of k!.
For n ≤ 4, all permutations are shown completely.
🎯 Combinations – Choosing Without Order
We choose k pebbles out of n.
Order does not matter, so {1,4,5} = {5,1,4}.
- Highlighted pebbles show the chosen set
- All combinations are listed when n ≤ 7
- Larger cases show the first few examples
The beauty of combinations is that the mind instantly sees why
C(n, k) grows in a triangular pattern.
🌿 Powers – ab Visualized
To compute ab, the visualizer shows:
- b boxes representing positions
- a choices inside each box
- Example sequences
- A branching tree (when small)
This reveals the meaning of exponents as
“all possible sequences of choices.”
🙏 Closing Thoughts
Mathematics becomes effortless when every formula has a picture behind it.
This Pebble Math Visualizer is designed for:
This Pebble Math Visualizer is designed for:
- students learning basics
- self-learners building intuition
- teachers who want visual clarity
- anyone who struggled with abstract symbols
Use it freely in your learning journey — it is part of the Programmer's Picnic mission to make education joyful.
Created with ❤️ by Programmer’s Picnic
Soft Saffron • Visual Learning • Pebble Mathematics
Soft Saffron • Visual Learning • Pebble Mathematics