
Bar Charts in Matplotlib — Baby Steps
Bar charts are simple, powerful, and everywhere — from marksheets to stock charts. Let’s learn them step-by-step with clear examples, and you can even run the code live below using Python (Pyodide)!
💡 Step-by-Step Tutorial
1) Import Matplotlib
import matplotlib.pyplot as plt2) Prepare your data
languages = ['Python', 'Java', 'C', 'C++', 'JavaScript']
students = [80, 65, 50, 40, 70]
3) Draw your first bar chart
plt.bar(languages, students)
plt.show()
4) Add colors and labels
plt.bar(languages, students, color='skyblue', edgecolor='navy')
plt.title("Programming Language Popularity")
plt.xlabel("Languages")
plt.ylabel("Number of Students")
plt.show()
5) Horizontal bars
plt.barh(languages, students, color='lightgreen')
plt.xlabel("Number of Students")
plt.show()
6) Add numbers on top
plt.bar(languages, students, color='#69b3a2')
for i, v in enumerate(students):
    plt.text(i, v + 1, str(v), ha='center')
plt.show()
💬 Tip: In the Pyodide practice section below, use matplotlib.use('Agg') and save your figure with plt.savefig() to display it.
📊 Sample static output:
'>
<text x='0' y='-10' font-family='Arial' font-size='18' fill='%23083349'>Programming Language Popularity</text>
<rect x='0' y='20' width='380' height='28' fill='%2369b3a2'/>
<rect x='0' y='60' width='320' height='28' fill='%23a1cbe0'/>
<rect x='0' y='100' width='260' height='28' fill='%23e6f7ff'/>
<rect x='0' y='140' width='210' height='28' fill='%23cfeef9'/>
<rect x='0' y='180' width='350' height='28' fill='%23a8d8f0'/>
<text x='420' y='40' font-family='Arial' font-size='12' fill='%23083349'>Python — 80</text>
<text x='420' y='80' font-family='Arial' font-size='12' fill='%23083349'>Java — 65</text>
<text x='420' y='120' font-family='Arial' font-size='12' fill='%23083349'>C — 50</text>
<text x='420' y='160' font-family='Arial' font-size='12' fill='%23083349'>C++ — 40</text>
<text x='420' y='200' font-family='Arial' font-size='12' fill='%23083349'>JavaScript — 70</text>
</g>
</svg>)
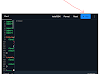
🧪 Practice: Run Matplotlib with Pyodide
Click Preload Pyodide once to install matplotlib and numpy. Then press Run & Render to display your chart as an image!
Idle
Console output:
No chart yet — run code to render a PNG here.
🧠 Tips & Notes
- Always call
matplotlib.use('Agg')when plotting in Pyodide. - Pyodide runs in your browser, so it can be slow on the first load.
- If the code doesn’t run, try refreshing and clicking “Preload Pyodide” again.


0 Comments